web UI and Streaming Statistics Page
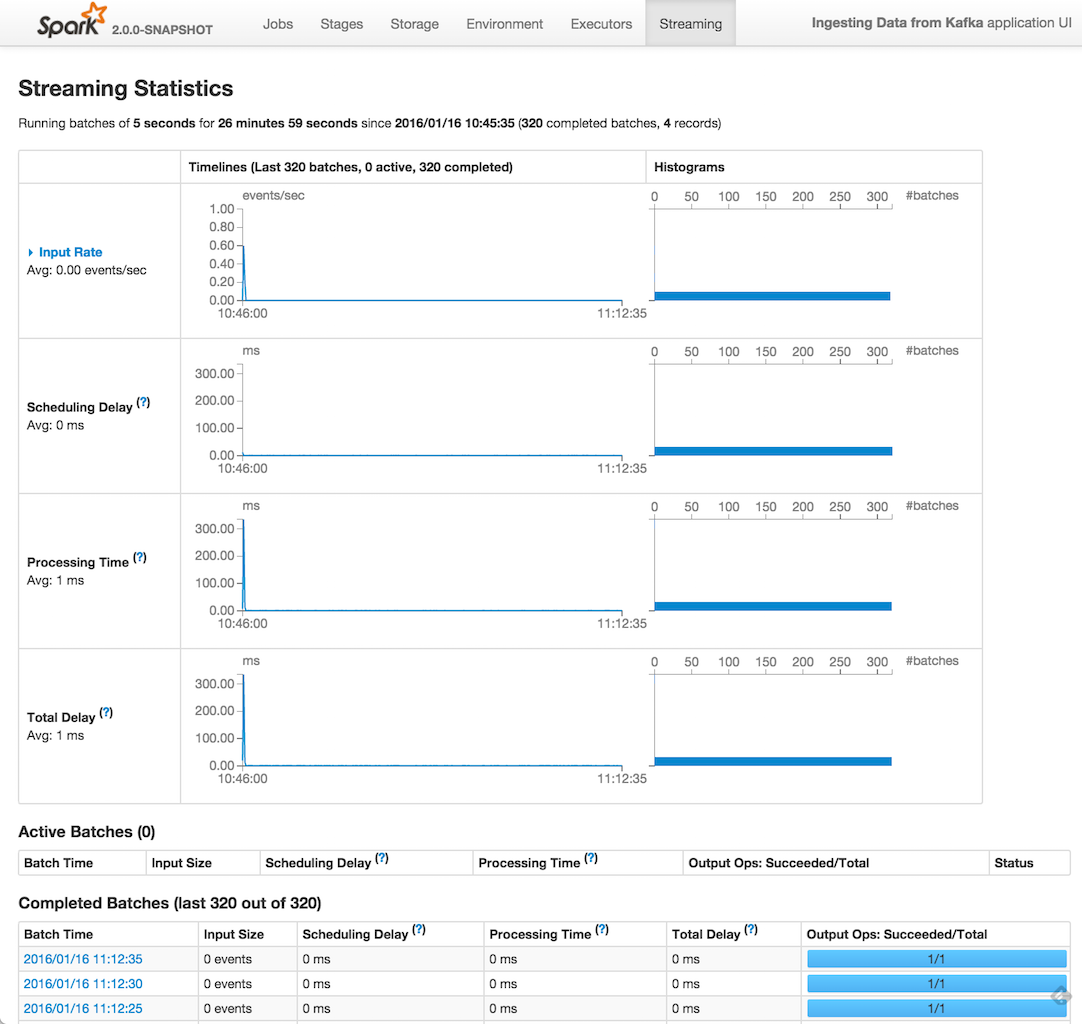
When you start a Spark Streaming application, you can use web UI to monitor streaming statistics in Streaming tab (aka page).
Figure 1. Streaming Tab in web UI
|
Note
|
The number of completed batches to retain to compute statistics upon is controlled by spark.streaming.ui.retainedBatches (and defaults to 1000).
|
The page is made up of three sections (aka tables) - the unnamed, top-level one with basic information about the streaming application (right below the title Streaming Statistics), Active Batches and Completed Batches.
|
Note
|
The Streaming page uses StreamingJobProgressListener for most of the information displayed. |
Basic Information
Basic Information section is the top-level section in the Streaming page that offers basic information about the streaming application.
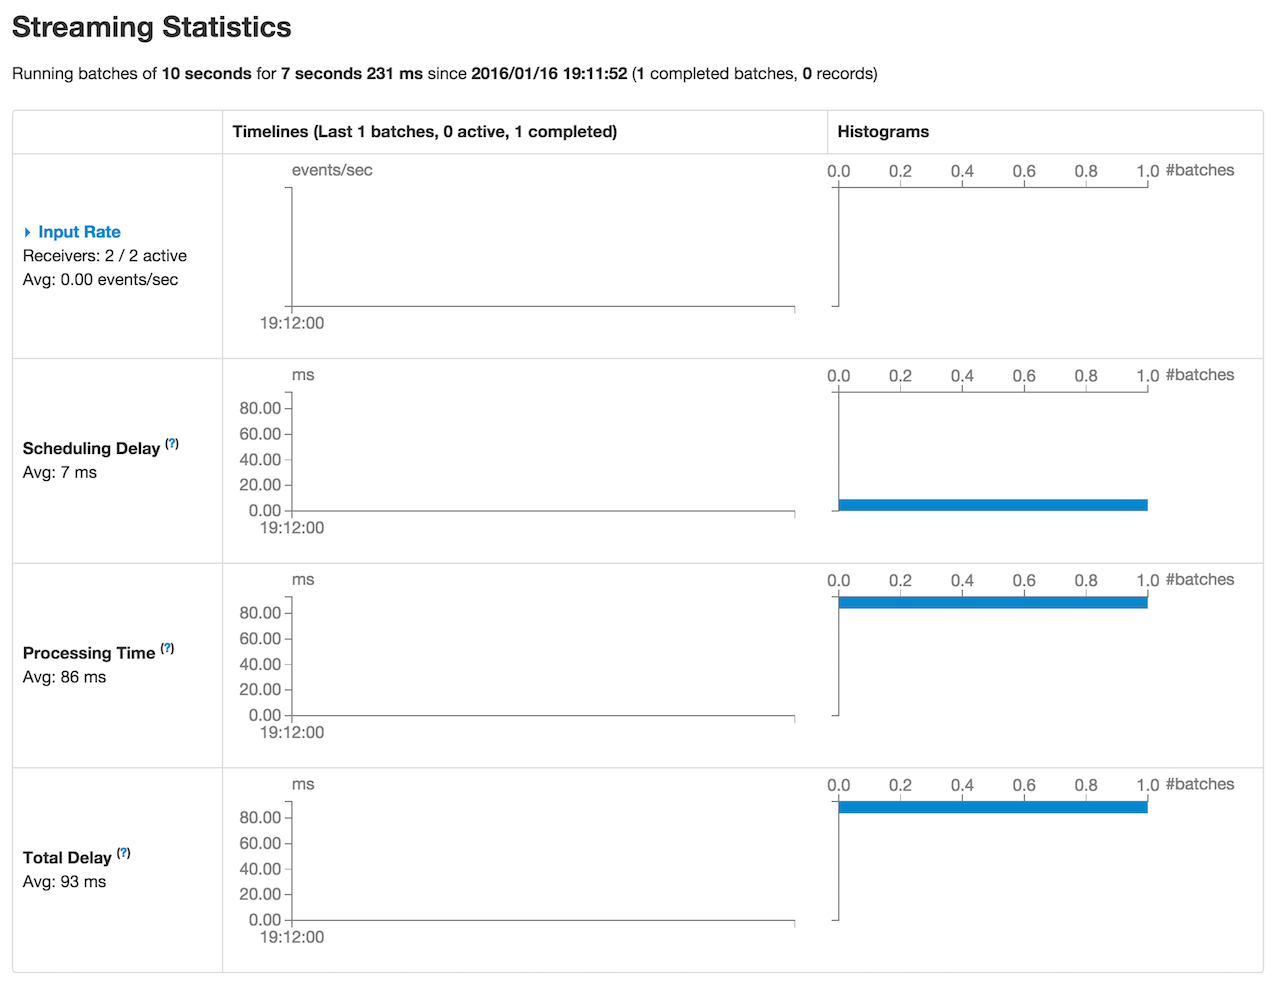
Figure 2. Basic Information section in Streaming Page (with Receivers)
The section shows the batch duration (in Running batches of [batch duration]), and the time it runs for and since StreamingContext was created (not when this streaming application has been started!).
It shows the number of all completed batches (for the entire period since the StreamingContext was started) and received records (in parenthesis). These information are later displayed in detail in Active Batches and Completed Batches sections.
Below is the table for retained batches (i.e. waiting, running, and completed batches).
In Input Rate row, you can show and hide details of each input stream.
If there are input streams with receivers, the numbers of all the receivers and active ones are displayed (as depicted in the Figure 2 above).
The average event rate for all registered streams is displayed (as Avg: [avg] events/sec).
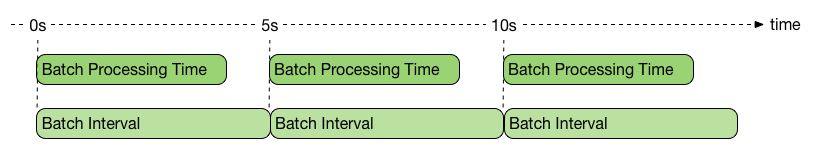
Scheduling Delay
Scheduling Delay is the time spent from when the collection of streaming jobs for a batch was submitted to when the first streaming job (out of possibly many streaming jobs in the collection) was started.
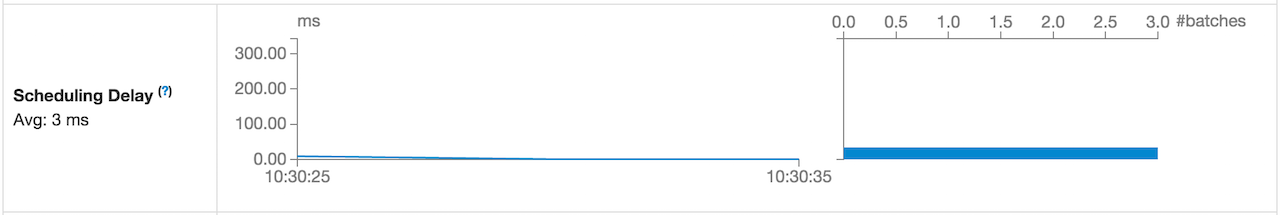
Figure 3. Scheduling Delay in Streaming Page
It should be as low as possible meaning that the streaming jobs in batches are scheduled almost instantly.
|
Note
|
The values in the timeline (the first column) depict the time between the events StreamingListenerBatchSubmitted and StreamingListenerBatchStarted (with minor yet additional delays to deliver the events). |
You may see increase in scheduling delay in the timeline when streaming jobs are queued up as in the following example:
// batch duration = 5 seconds
val messages: InputDStream[(String, String)] = ...
messages.foreachRDD { rdd =>
  println(">>> Taking a 15-second sleep")
  rdd.foreach(println)
  java.util.concurrent.TimeUnit.SECONDS.sleep(15)
}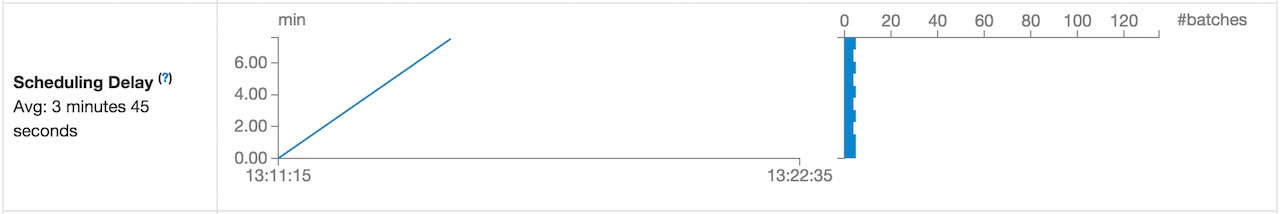
Figure 4. Scheduling Delay Increased in Streaming Page
Completed Batches
Completed Batches section presents retained completed batches (using completedBatchUIData).
|
Note
|
The number of retained batches is controlled by spark.streaming.ui.retainedBatches. |
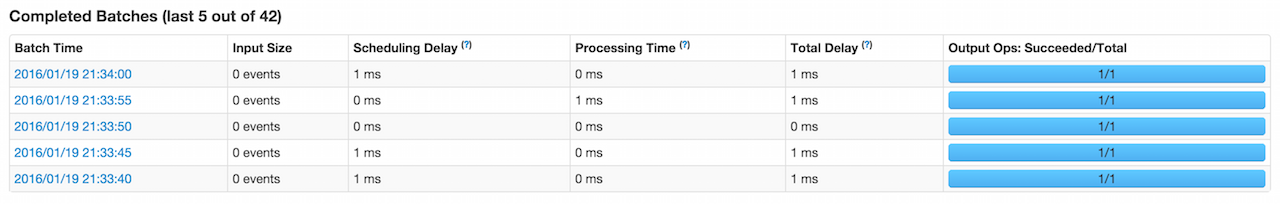
Figure 6. Completed Batches (limited to 5 elements only)
Example - Kafka Direct Stream in web UI

Figure 7. Two Batches with Incoming Data inside for Kafka Direct Stream in web UI (Streaming tab)
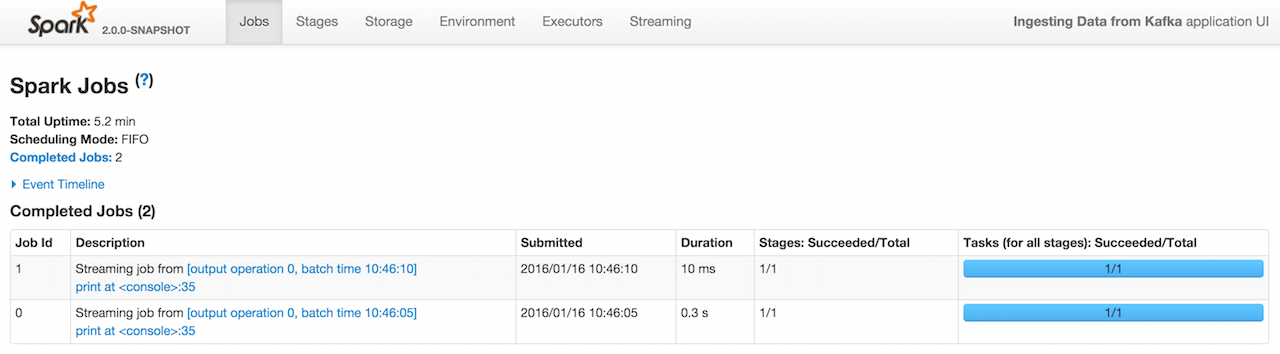
Figure 8. Two Jobs for Kafka Direct Stream in web UI (Jobs tab)